Lizard Chat: ask for a chart and the answer arrives with it
-
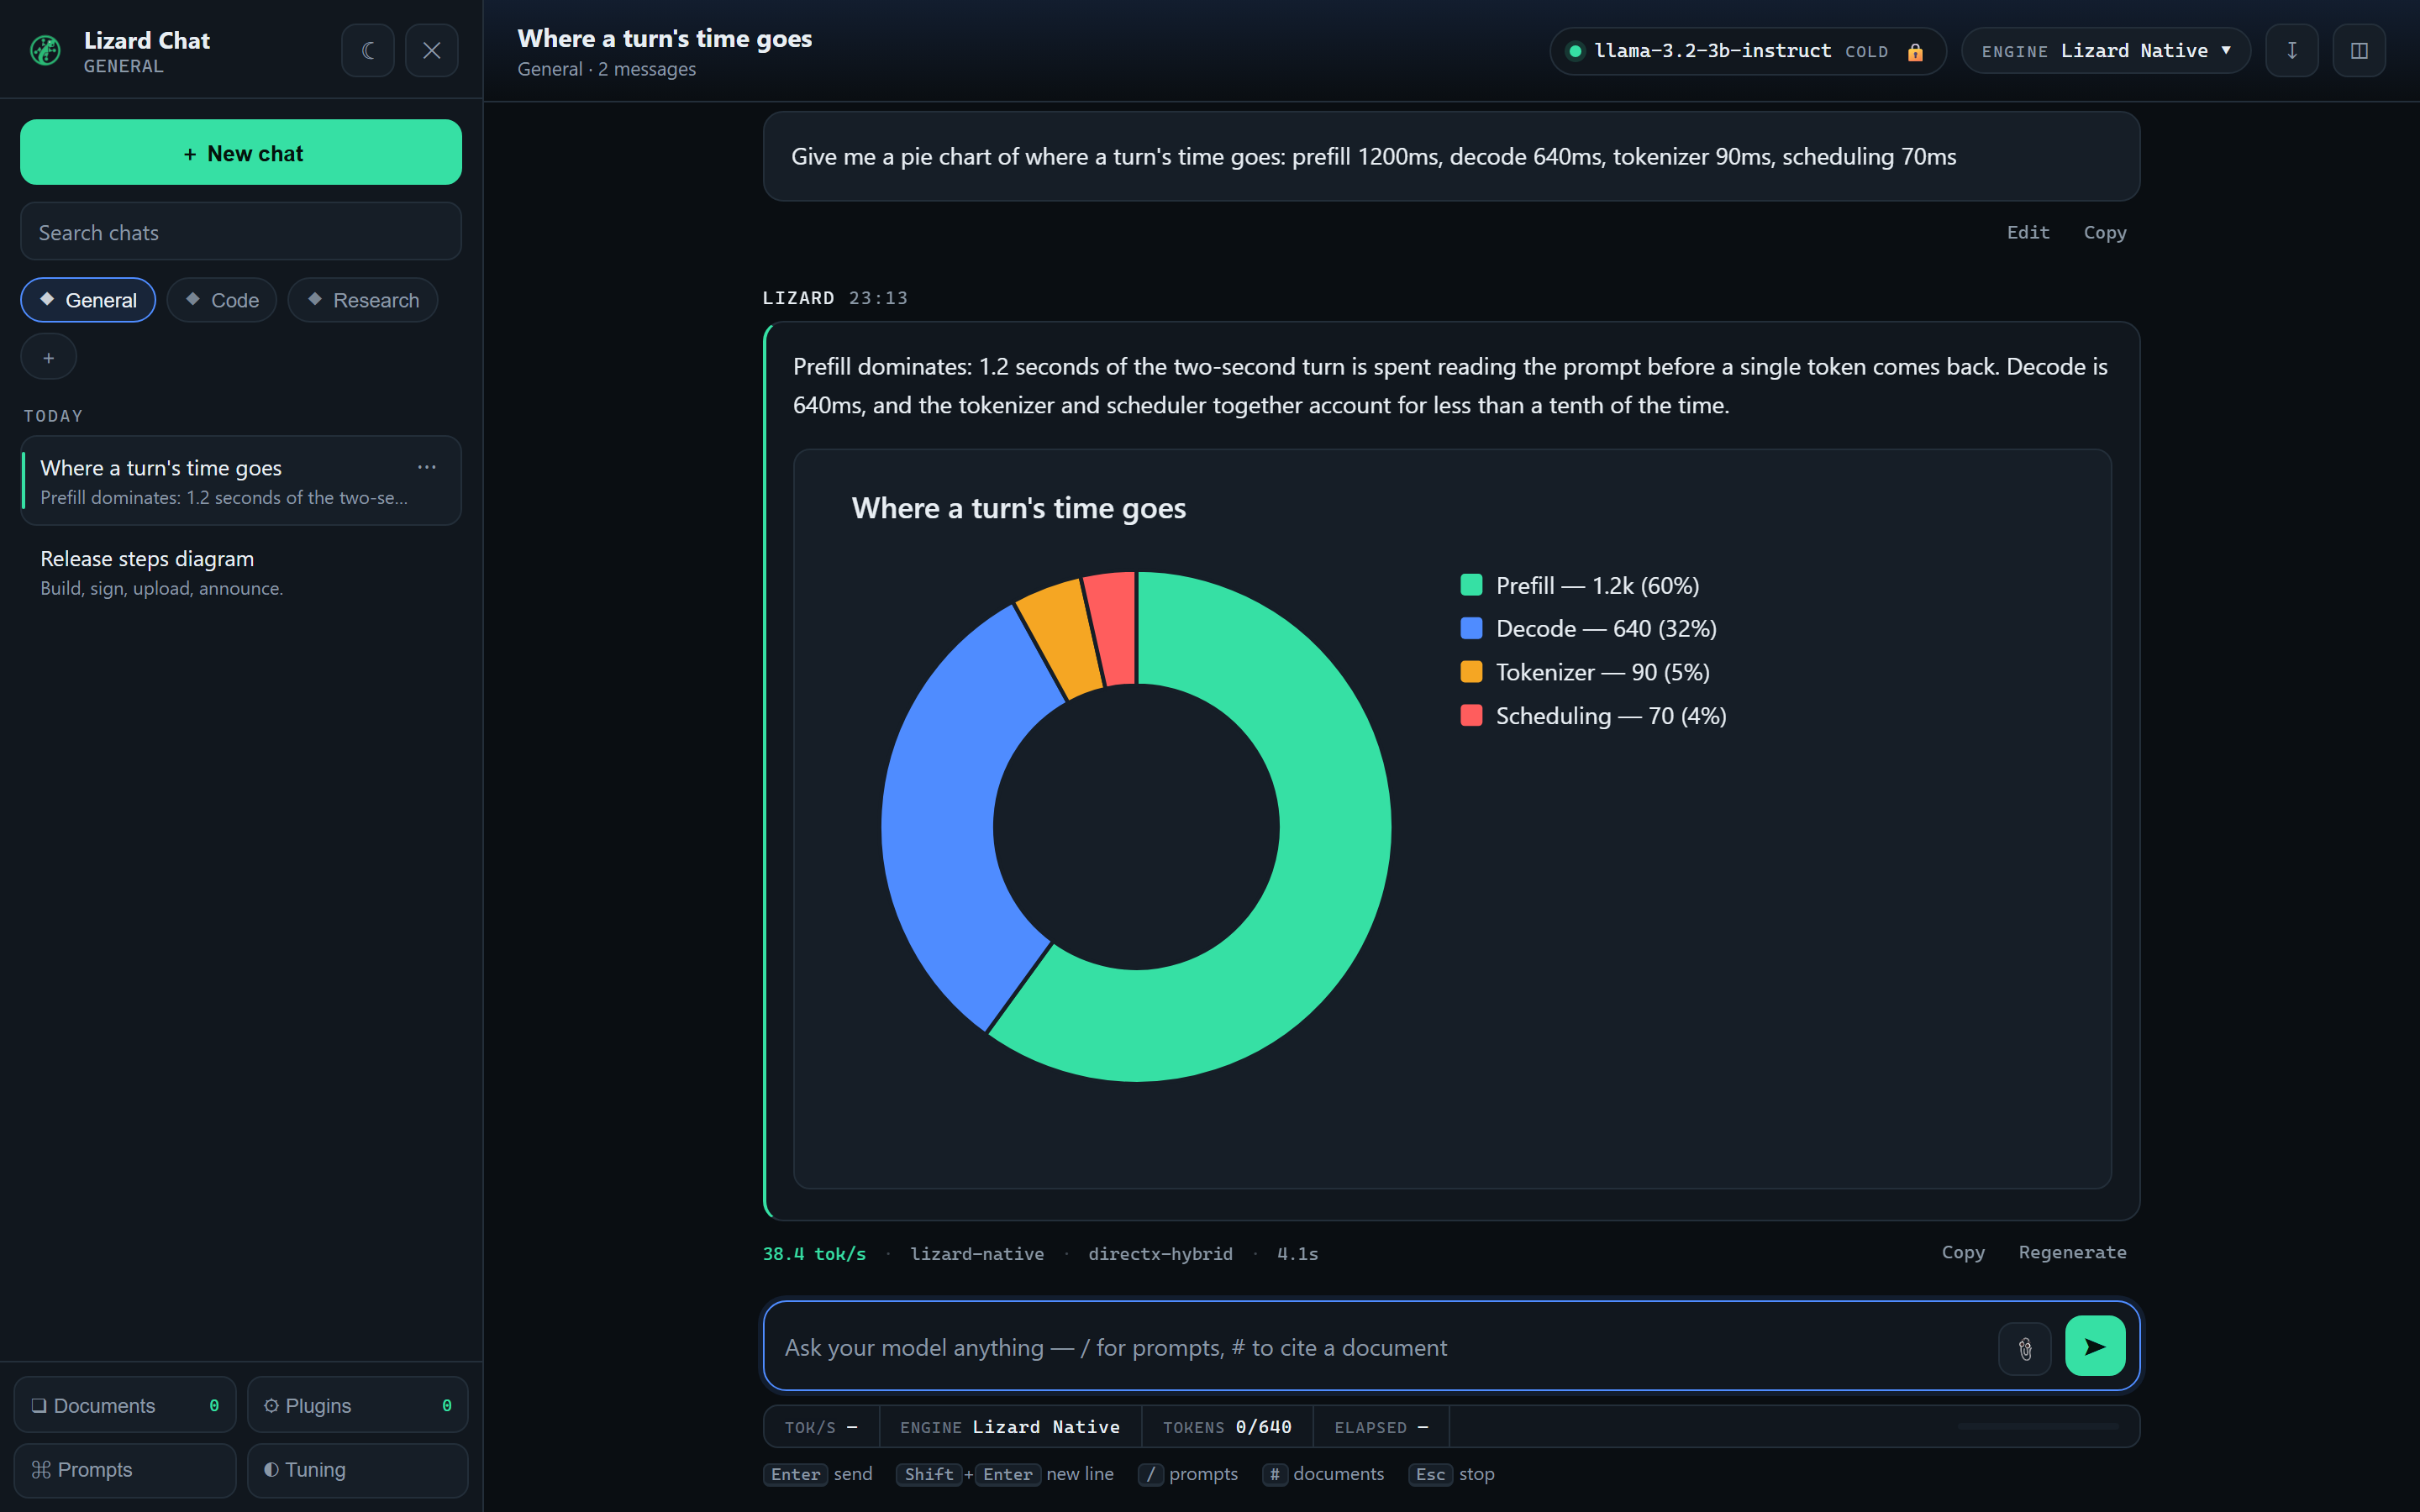
Lizard Chat is the chat workspace built into the app, running on whatever model you activated. Since 1.2.52 it draws charts — and there is no chart button, no menu and no special syntax to learn.
How it decides
Ask a question that wants a picture and you get one:
Show me a bar chart of my disk use in GB: models 22.2, benchmark history 0.17, logs 0.4Plot the price over the last four months: 3.10, 3.40, 3.25, 3.90Draw a diagram of how a release happens: build, sign, upload, announceGive me a pie chart of my week: coding 30 hours, meetings 8, reading 4
The wording only decides which example the model is shown. The model emits the chart type itself and can overrule that suggestion. Asked to "make a diagram of revenue by quarter", llama-3.2-3B returned a line chart — four quarters of revenue are a trend, not a flowchart.
It can also decide a chart would not help and just answer.
Six shapes
bar · line · area · pie · scatter · flow (boxes and arrows, for processes and architectures)
What it will not do
It will not draw something misleading. A single data point, a value it cannot read, a diagram with nothing connected — you get the written answer and no chart, rather than a picture implying data that was never there.
Where it runs
Everything: your message, your documents, the answer, the chart. The charting library ships inside the installer, so charts render with the network switched off. Nothing in the chat crosses the network.
The rest of the workspace
Saved and searchable conversations grouped by day, pin/rename/export as Markdown. Questions about your own text, Markdown, CSV, log and source files, with citations. Separate workspaces (General, Code, Research) each with their own instructions and documents. MCP plugins for folders, web pages, SQLite files and Git history.
Full details: https://lizard-llm.qendryx.com/chat.html
Question for the room: what did you ask it to chart, and did it pick the shape you expected?
Hello! It looks like you're interested in this conversation, but you don't have an account yet.
Getting fed up of having to scroll through the same posts each visit? When you register for an account, you'll always come back to exactly where you were before, and choose to be notified of new replies (either via email, or push notification). You'll also be able to save bookmarks and upvote posts to show your appreciation to other community members.
With your input, this post could be even better 💗
Register Login