New benchmark evidence: completed provider comparisons
-
These four captures show why the dashboard keeps provider rows and analysis separate. The same machine can produce a different winner in a different run, and a composite recommendation is never allowed to erase the underlying values.
Interactive gallery: https://lizard-llm.qendryx.com/benchmarks.html
Five rows, five completed measurements
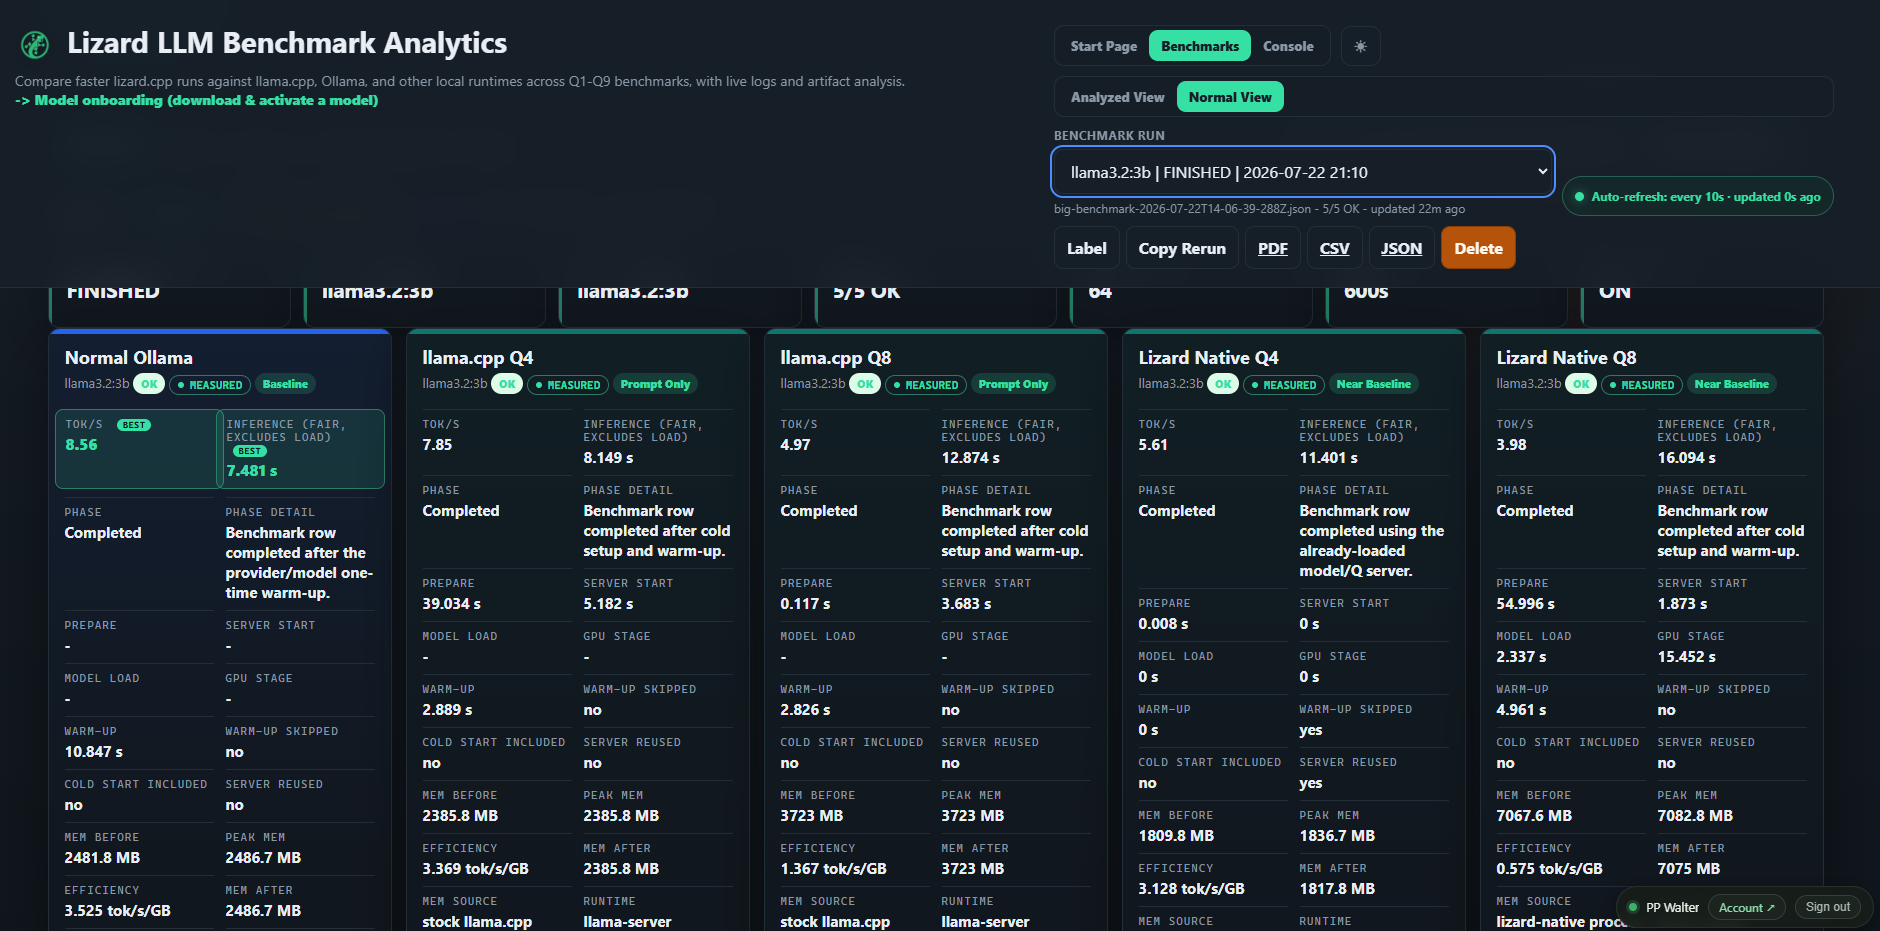
Ollama records 8.56 tok/s, stock llama.cpp Q4 7.85, and Lizard Native Q4 5.61 in this run. Load, warm-up and memory evidence stay visible beside throughput.
A second run changes the order
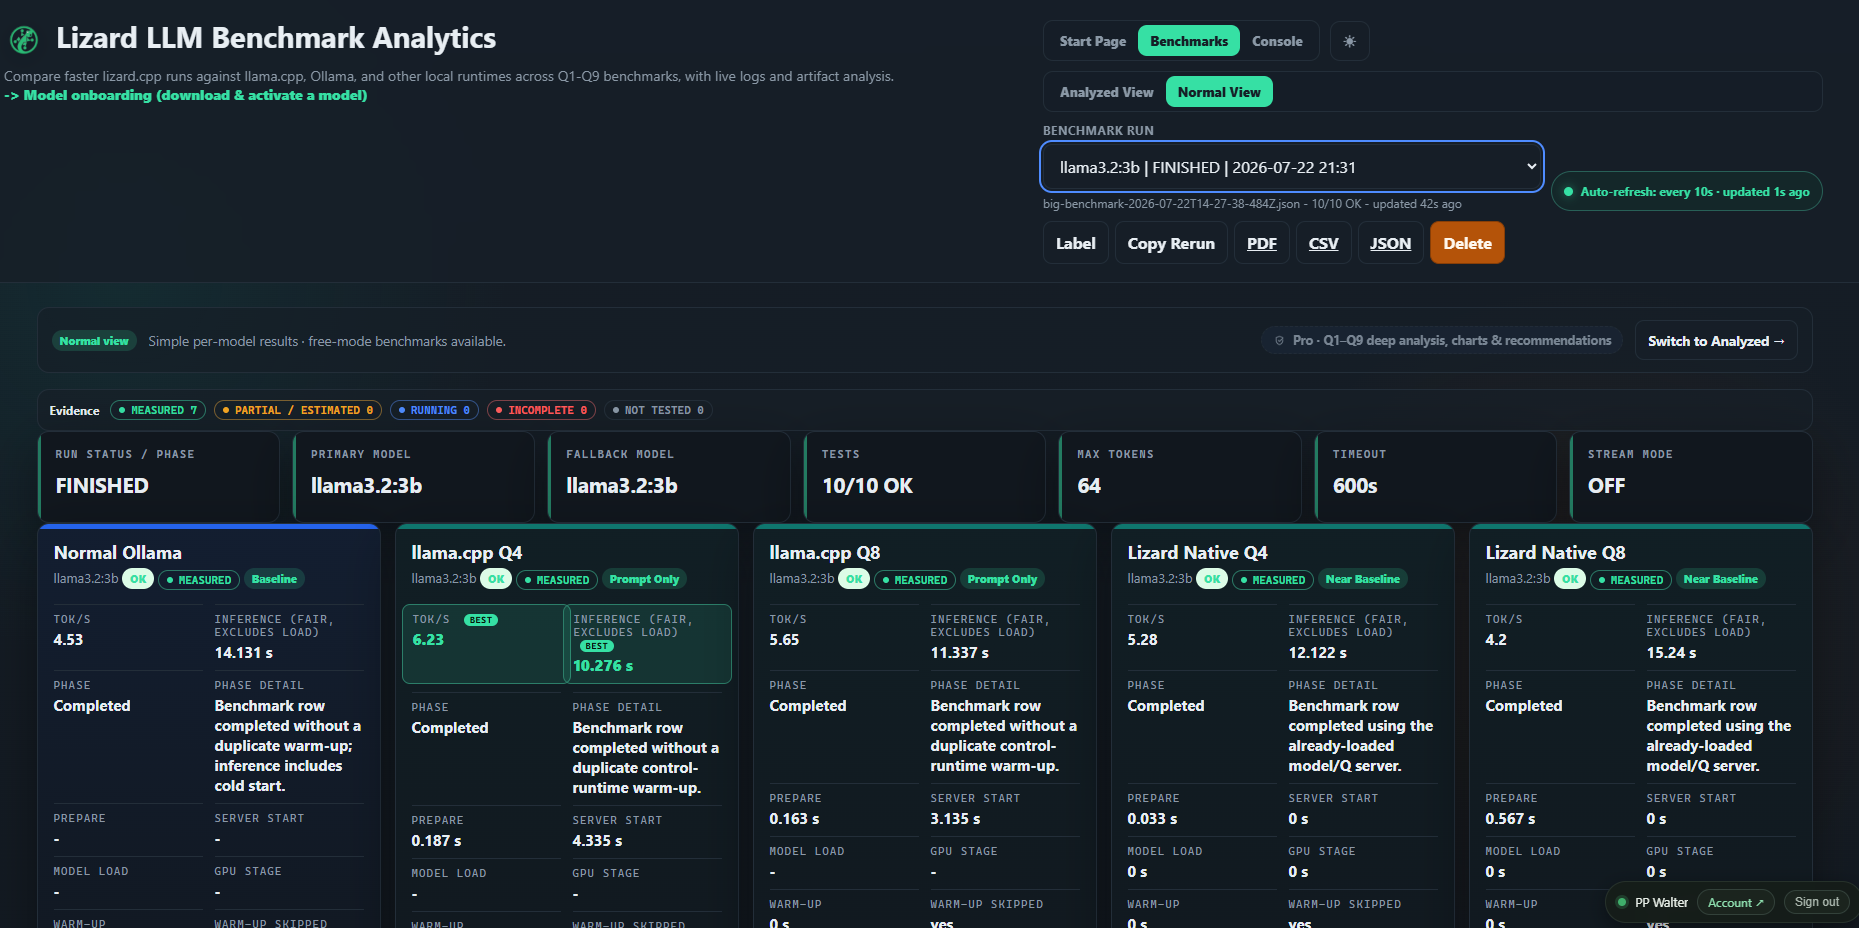
In this separate 10/10 run, llama.cpp Q4 reaches 6.23 tok/s, Lizard Native Q4 5.28, and Ollama 4.53. The result belongs to this model, machine and run—not a universal ranking.
Leaderboard plus metric-specific winners
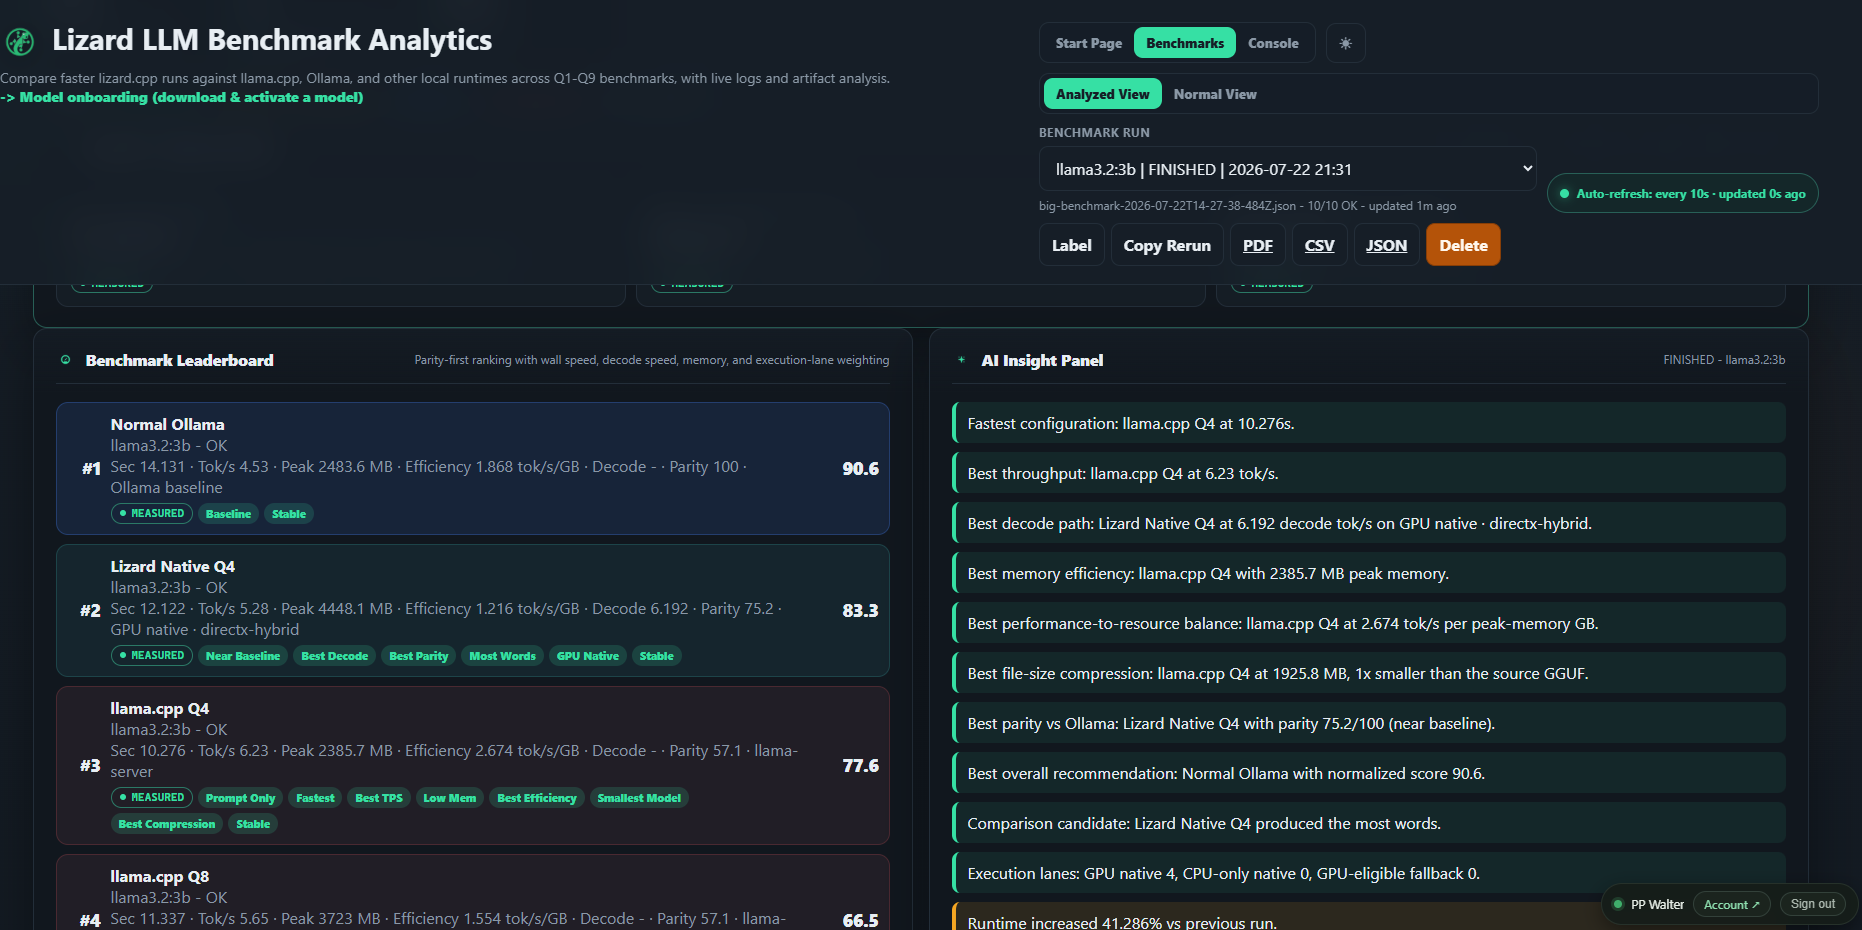
Ollama leads the composite score, Lizard Native Q4 takes best native decode and parity among the compared rows, and llama.cpp Q4 leads wall time and end-to-end tokens per second.
Recommendations stay attached to source evidence
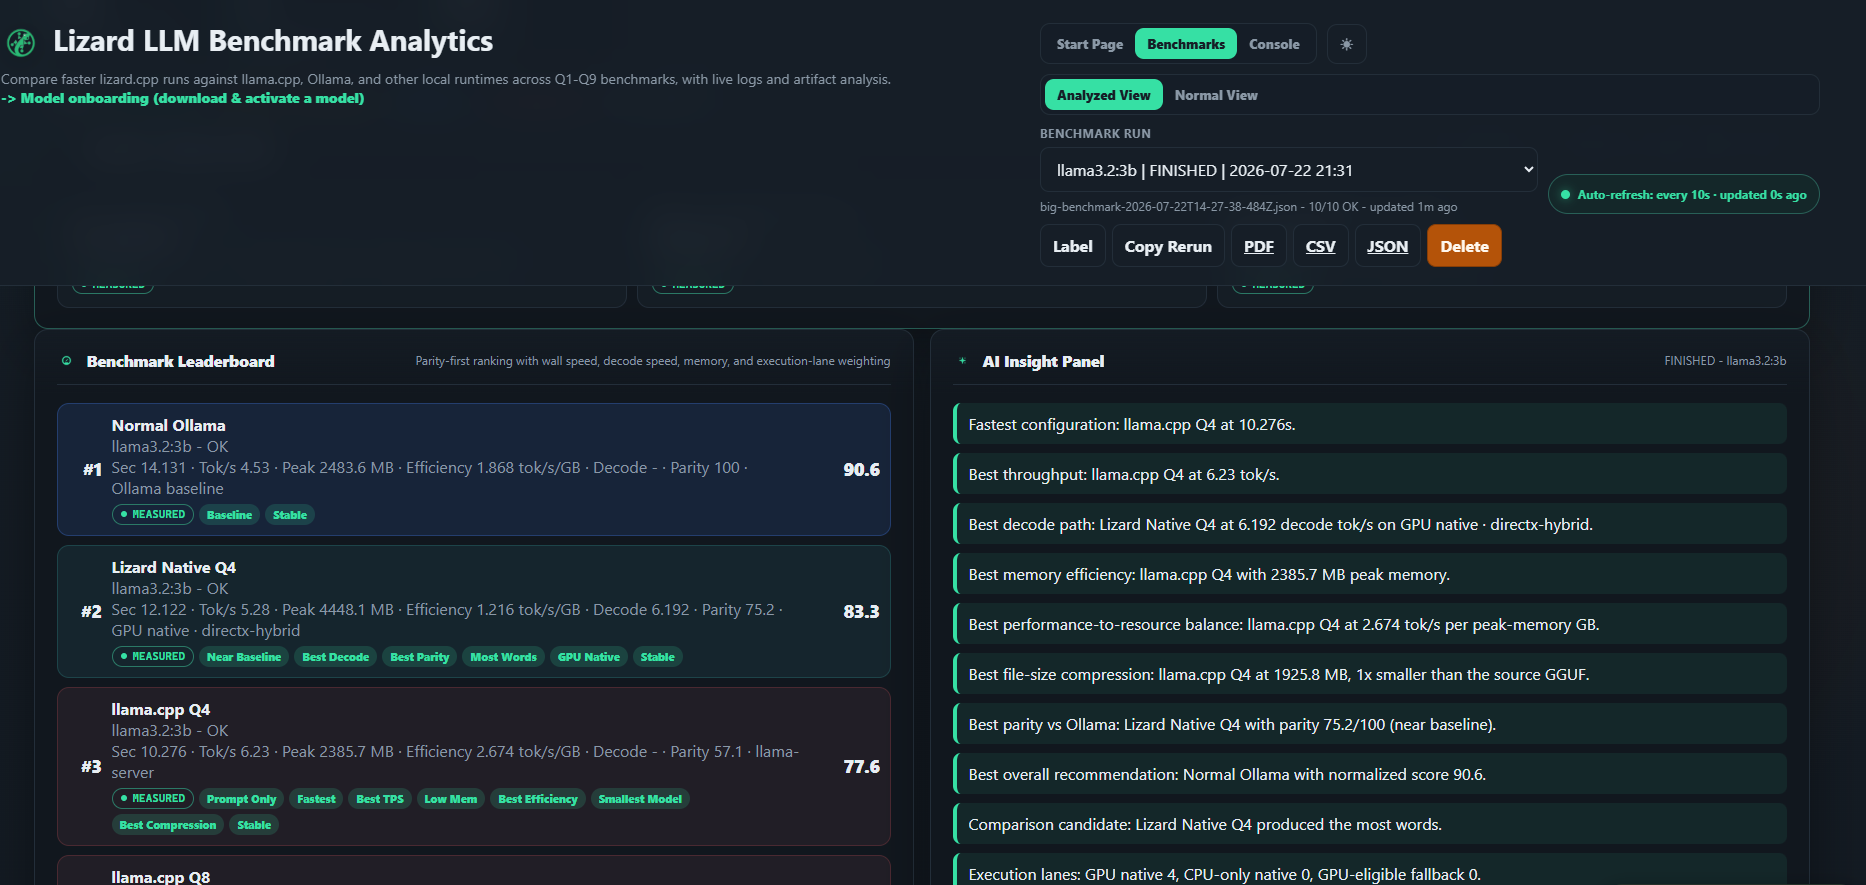
Scores, badges, execution lanes and raw provider values remain on the same screen. The recommendation annotates the run; it does not replace it.
Question for you: On your hardware, which decision should come first: shortest wall time, steady decode speed, peak memory, or answer parity?
Hello! It looks like you're interested in this conversation, but you don't have an account yet.
Getting fed up of having to scroll through the same posts each visit? When you register for an account, you'll always come back to exactly where you were before, and choose to be notified of new replies (either via email, or push notification). You'll also be able to save bookmarks and upvote posts to show your appreciation to other community members.
With your input, this post could be even better 💗
Register Login